The 2015 Sourcebook Readership Survey
NOTE: Survey year altered to better reflect actual Data set. For example, before the alteration this would have been the 2016 Sourcebook Survey.
It’s that time of year again, when Fuel Oil News provides its readers with its annual sourcebook survey. The goal is to offer a snapshot of our readership (relative to the specific respondents that year) that represents a comparison benchmark. We received 120 final responses this year from a range of companies. Our staff would like to thank those who participated. Your help with the survey helps the industry as a whole by supporting this useful project.
While some long-term trends can be observed, the mix of respondents changes year to year. So, each survey should be taken on its own merits. We do provide, up front, a picture of the demographics of the specific respondent group.
We comb though the data to eliminate failed survey responses. Within the accepted data, some respondents might be smaller dealer operations, and others larger marketer/wholesaler operations that are far from typical and that might only operate home heating oil delivery and service as a division of a much larger and more diversified operation. This survey is confidential and we cannot (nor would we) specifically identify the companies that provided a response, but a thoughtful look at the outliers would suggest the above assumptions are accurate. However, both the typical smaller fuel oil dealer and large regional diversified petroleum and fuel-oil specific marketers are part of the industry’s competitive landscape.
Responses are also rounded to an even number.
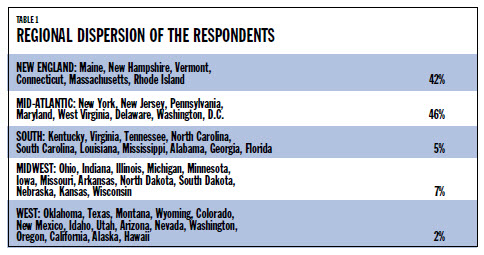
REGIONAL DEMOGRAPHICS
From a regional perspective, and as is typically the case, the vast majority of respondents were from New England or the Mid-Atlantic states. Multiple regions could be selected.
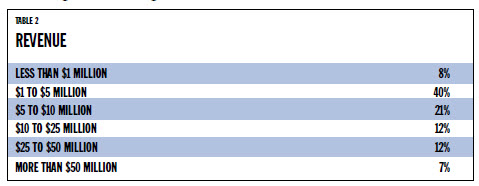
REVENUE
From a revenue standpoint (and as has been the case for several years now), the majority of respondents (40%) enjoy revenues between $1 million and $5 million. Following that, some 21% had revenue between $5 to $25 million. Notable this year was a general move upward in respondent revenue.
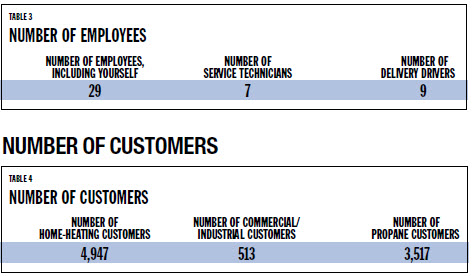
NUMBER OF EMPLOYEES
The average operation featured about 29 employees. This included some very large outliers and a number of very small operations.
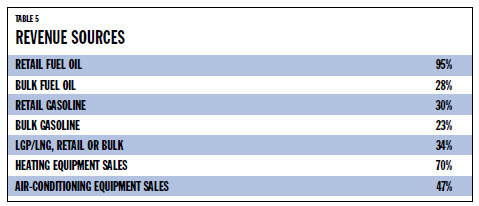
SOURCES OF REVENUE
Retail fuel oil was, not surprisingly, a primary source of income for 95% of respondents. Some 28% provided bulk fuel oil and a significantly increased (over 2014) 34% provided propane service and a notably reduced (compared to 2014) 70% HVAC sales and service.
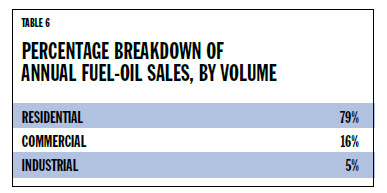
FUEL OIL SALES BY VOLUME
When looking at the percentage of fuel oil sales by volume, it is similarly not surprising that roughly 79% of that volume goes to residential customers.
BIOFUEL AND ULTRA LOW SULFUR
There has been a strong movement in the industry towards biofuel-based heating oil and ultra-low sulfur diesel. This has been driven for a range of reasons— these green fuels tend to appeal to residents in the primary heating markets; they can significantly simplify heating appliance maintenance; and they represent an opportunity to be an acceptable fuel in any low carbon fuel standard that might be set in key heating oil markets. Nearly half of respondents (46%) sold a biofuel blend. Of those selling a blend, 91% of the respondents sold B5 (5% mixture), and 21% sold B20 (20% mixture). In the “other” category, some respondents sold blends between 2% and 99%. In addition to biofuel, 75% sold a heating fuel with ultra-low sulfur content which has seen significant growth as many states in the Northeast see ULS mandates come into effect.
PETROLEUM FUTURES, PRICE PROTECTION AND ONLINE ORDERING
Some 51% with this year’s respondents participate in the futures market. Somewhat more at 60% offer price protection programs. Of those that offer price protection 25% of their customers take advantage of the opportunity. Some 44% of respondents charge a fee for the program and 23% a buyout option. Half of respondents (50%) offer their customers online ordering.
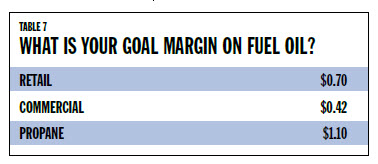
FUEL MARGIN
The average fuel margin was fairly consistent among respondents; however, several fuel oil marketers had goals almost twice as high as the average.
BULK PLANT OPERATIONS
Some 59% of respondents operated a bulk plant with an average storage capacity of 421,950 gallons. It should be noted that a number of larger respondents had millions of gallons of storage. With those removed a more typical “dealer/marker” figure would be 196,962 gallons. Some 80% of respondents stored other petroleum products in their bulk plants and 69% had substantially upgraded their bulk plants in the past 10 years.
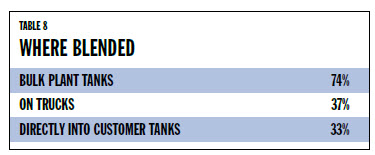
FUEL ADDITIVES
Roughly 85% of the respondents used fuel oil additives. The additives were blended in a variety of manners that often overlapped.
THE SERVICE DEPARTMENT
Roughly 74% of respondents operated a service department.
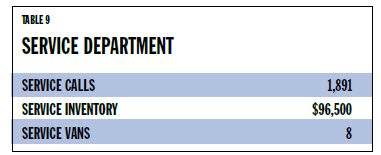
The figures for service vans track well with the number of service technicians noted earlier in the survey. Some 51% of respondents indicated they were considering the purchase of new service vehicles in the coming year.
DELIVERY TRUCKS
For delivery trucks, the optimal desired storage capacity among respondents averaged out at 3,085 gallons.
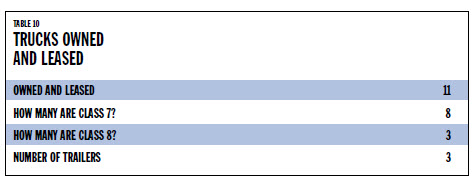
Some 42% of respondents indicated that they would likely be buying a new truck in the coming year and 15% indicated that they would be buying a new tank to mount on existing chassis.
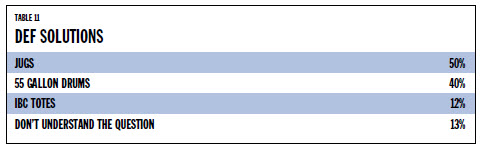
DIESEL EXHAUST FLUID
New environmental regulations require that diesel engines offer enhanced emissions technology. This involves either selective catalytic reduction (SCR) or exhaust gas recirculation (EGR). SCR technology provides a notable boost in fuel efficiency and power compared to EGR, but requires the use of diesel exhaust fluid (DEF) that is stored in a separate tank. SCR technology is seen as being the dominant technology between the two alternatives. Respondents were asked to identify how they were going to meet the DEF requirements for their fleets of vehicles.
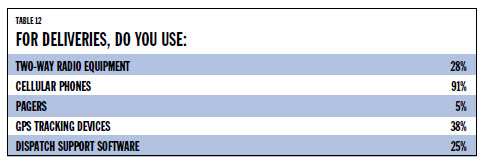
DELIVERY TECHNOLOGY
Where delivery technology is concerned, cellular phones play a dominant role in the delivery process. However, two-way radio equipment, GPS tracking and dispatch support software each has a solid user base among respondents.
CUSTOMER TANKS
Respondents reported that between the two most common sizes, 82% of their home heating customers had 275 gallon tanks, and18% had 550 gallon tanks.
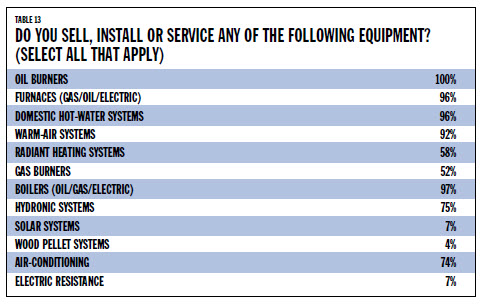
HVAC EQUIPMENT AND SERVICE
Roughly 74% of respondents install and/or service heating and cooling equipment. As would be expected, oil related appliances were heavily sold, installed and serviced (with 100% of respondents selling oil burners). However, 7% were involved with solar heating, 74% with air-conditioning, 4% with wood pellet appliances and 52% with gas burners.
The vast majority of the HVAC business was residential—87%, and some 80% of respondents noted an increase in residential business in the previous year. For the commercial side, 60% of respondents noted an increase in commercial business during the previous year. A total of 87% of respondents noted they recommended a brand name to their customers when a replacement was required.
OTHER BUSINESS OPERATIONS
A total of 40% of respondents reported having significant business operations outside of residential and commercial heating. Examples cited include: agriculture, branded gasoline/c-stores; rental properties; tires, mechanic, yard products, excavating, lubricants, marine fuel dock, centrifuge S&S, moving and storage, wholesale sporting goods distribution, concrete, coal, sand, stone, minor plumbing, mobile boilers, home security, firewood, water, earthwork, energy audits, wood pellet deliveries, used car sales and property leasing.
MARKETING AND PROMOTION
Aside from contributions to associations for group campaigns, 68% of respondents conducted their own advertising. This included: Web, local sports advertising, local newspaper, radio, TV, google ads, pay per click, direct mail, local periodicals and phone book, bill boards and social media. Some 51% specifically cited using direct mail. A total of 39% of respondents leveraged public relations to help with their marketing that included: emails, texting, sponsorships, discount coupons, donations to charitable events, freight boards, newsletters, social media, customer meetings, fairs, home shows, door-to-door awareness programs and NORA promotions. Some 82% of respondents were members of industry trade associations and 49% of those indicated at least some involvement with the associations’ legislative support activities.
THE NATURAL GAS THREAT
Some 81% of respondents reported losing customers to natural gas conversions. The average number of customers lost was reported as 68 which included a number of obviously larger companies. Excluding those with triple digit or more loss and the “smaller dealer” figure is closer to 20. Some 64% see this as a serious threat which is considerably down from last year, possibly linked to currently stable, lower oil prices. Some 39% are aggressively working to counteract the threat. Here are some of their efforts:
- We are selling propane, also.
- Whatever it takes. Problem is you find out when it’s too late
- Communication, Bioheat fuel promotion and awareness.
- Keeping up our high standard of customer service and clean burning combustion etc.
- Selling biodiesel; CSR training for communication; budget contracts for monthly payments.
- We also do gas conversions and service.
- Explain total cost to convert. Suggesting same funds be used for control of heat loss.
- Gas conversions peaked in Central Massachusetts a decade ago. A fuel price is the driver to conversion. Little can be done by marketing to overcome the difference in fuel prices. Today the price of gas in some areas is higher than oil and the conversions stopped. In fact, we see large commercial customers ordering oil in a very limited manner.
- Need to counter the perceived ‘domestic’ source of gas by explaining that the United States now produces petroleum products for heating oil as well. In my opinion, “American Produced” is a much more powerful selling tool than “Biofuel” and far easier for the customer to understand.
- Explaining advantages of a small family business over 100 years old that actually cares about them.
- Explaining oil’s advantage over gas. Dedicated service for oil vs. for gas.
- PAC and lobby.
- Natural gas has been in our market for years—existing fuel oil customers are rural and either use LPG or fuel oil.
- Began marketing heat pumps as a better value vs converting.
- Technician sales training; installing new efficient heating oil equipment.
Pretty nice post. I just stumbled upon your weblog and wished to say that I’ve really enjoyed browsing your blog posts. In any case I will be subscribing to your rss feed and I hope you write again very soon!