EIA Winter Fuels Outlook
 EIA expects that average household bills for most major energy sources of home heating will rise this winter because of higher forecast energy prices. Temperatures are expected to be roughly the same as last winter in much of the country. Forecast winter home heating expenditure changes vary significantly by both fuel and region. On average, EIA expects natural gas bills to rise by 5%, home heating oil by 20%, and electricity by 3%. However, expenditures for homes that use propane are expected to be about the same as last winter. Although the increased expenditures largely reflect higher energy prices rather than colder temperatures, a warmer-than-average winter would see smaller increases in expenditures and a colder-than-average winter would see larger increases in expenditures compared with last winter.
For this outlook, EIA defines the winter season as the period from October through March. The average household winter heating fuel expenditures discussed [here] should be considered a broad guide to compare recent winters. Fuel expenditures for individual households are highly dependent on the size and energy efficiency of individual homes and their heating equipment, along with thermostat settings, local weather conditions, and market size.
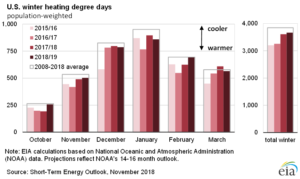
Temperatures for the winter of 2018–19, based on the most recent forecast of heating degree days (HDD) from the National Oceanic and Atmospheric Administration (NOAA), are expected to be roughly similar to last winter for most of the country. On a national-average basis, temperatures last winter were generally close to the 10-winter average. HDD are a rough measure of how cold temperatures are compared with a base temperature—more HDD indicate colder temperatures. On average, HDD for the winter of 2018–19 across the United States are expected to be 1% higher than last winter. However, the forecast varies among the regions, with forecasts ranging from 7% more HDD than last winter in the West region to 3% fewer HDD than last winter in the Midwest region.
Although NOAA’s forecast for this winter indicates temperatures could be close to levels from both last winter and the typical winter from the past 10 years, recent winters provide a reminder that weather can be unpredictable. The winters of 2013–14 and 2014–15 were generally colder than normal, but the winters of 2015–16 and 2016–17 were much warmer than normal. Recognizing this potential variability, the Winter Fuels Outlook includes scenarios where HDD in all regions are 10% higher (colder) or 10% lower (warmer) than forecast.
This outlook benchmarks energy consumption data to EIA’s 2015 Residential Energy Consumption Survey (RECS) data, released earlier in 2018. Because of methodological changes compared with previous RECS, consumption and expenditure data in this Winter Fuels Outlook are not comparable to previous years’ editions of the Winter Fuels Outlook.
Heating Oil: EIA expects households whose primary space heating fuel is heating oil to spend an average of $269 (20%) more this winter than last winter, reflecting retail heating oil prices that EIA forecasts to be 50 cents per gallon (gal) (18%) higher than last winter and consumption that EIA forecasts to be 1% higher than last winter.
Higher fuel prices and forecast winter temperatures, which are close to the recent 10-year average, result in winter heating oil expenditures that EIA expects to be the highest in the last four years.
In the scenario that assumes a 10% colder-than-forecast winter, projected expenditures for heating oil are $458 (33%) higher than during last winter. In this case, EIA forecasts heating oil prices to be 57 cents/gal (21%) higher than last winter and consumption to be 11% higher. In the 10% warmer scenario, EIA forecasts expenditures to be $102 (7%) higher than last winter, resulting from heating oil prices that are 45 cents/gal (16%) higher than and consumption that is 8% lower than last winter.
Customers in the Northeast region rely on heating oil more than in any other region. About 21% of households in this region use oil for space heating, down from 27% seven years ago. An increasing number of homes in the Northeast have switched to natural gas and electricity for space heating. Nationwide, 4% of households use heating oil for space heating.
Heating oil prices are expected to be higher this winter than last winter because of higher crude oil prices and higher distillate fuel margins (the price difference between wholesale distillate fuel and crude oil).
EIA forecasts that the Brent crude oil price, which is the most significant crude oil price in determining U.S. petroleum product prices, will average $79/barrel (b) this winter, which is $15/b (36 cents/gal) higher than last winter. Brent crude oil prices this winter are forecast to be higher than last winter as a result of gradually tightening global oil balances and concerns over potential supply disruptions in the coming months. Despite higher-than-expected crude oil prices last winter, EIA still expects crude oil prices to remain lower than their 2010–14 levels.
However, crude oil prices are highly uncertain, and any deviation in crude oil prices from forecast levels would cause a similar deviation in retail heating oil prices and consumer expenditures.
For winter 2018–19, EIA estimates that heating oil wholesale margins will average 38 cents/gal, which would be 5 cents/gal higher than last winter. Strong levels of domestic demand for distillate fuel, continued demand for U.S. distillate exports, and the expectation of close-to-normal temperatures this winter are expected to help contribute to higher heating oil margins.
Distillate fuel inventories (which includes heating oil) in the Northeast totaled 30.9 million barrels on September 28, which is 4.6 million barrels (13%) lower than at the same time last year, and 7.4 million barrels (19%) lower than the five-year (2013–17) average for that week.
Distillate inventories fell to very low levels earlier in 2018 because of continued growth in distillate demand, driven by strong global industrial and economic activity. In the Northeast, distillate fuel inventories were 19.0 million barrels on June 8, which was 40% lower than the five-year average for that time of year. However, inventory levels have risen by 11.9 million barrels (63%) since then.
Inventories have risen in part because U.S. refineries operated at record or near-record levels for much of the summer. Although U.S. refinery runs have declined in recent weeks because of typical seasonal maintenance, refineries continue to operate at a high level for this time of year.
The high level of refinery runs and an increase in distillate fuel yields have contributed to higher refinery output of distillate fuel. Higher distillate yields mean that for every barrel of crude oil run through a refinery, more distillate fuel is produced from that barrel, while production of other fuels is lower.
EIA expects strong refinery runs and strong distillate margins, both of which encourage refiners to maximize distillate production, to continue through the winter. EIA expects U.S. refinery production of distillate fuel to average 5.1 million b/d during the winter of 2018–19, which would be up from an average of 5.0 million b/d last winter.
However, if temperatures become severely cold, the Northeast typically increases imports of distillate fuel to help meet supply. As a result, prices have the potential to rise higher than forecast levels. Higher prices encourage imports to be shipped to the region. If a cold snap in the U.S. Northeast coincides with a cold snap in Europe, which is the main source of U.S. imports, additional upward pressure on distillate prices might occur.
Propane: About 5% of all U.S. households heat primarily with propane, and many of these households are in the Northeast and Midwest. EIA expects these households to spend roughly similar levels on average for heating this winter compared with last winter, but projected changes in expenditures vary by region. EIA expects that households heating with propane in the Northeast will spend an average of $22 (1%) more this winter than last winter, reflecting prices and expenditures that are both about 1% higher than last winter. EIA expects households in the Midwest to spend an average of $24 (2%) less this winter, reflecting average prices that are about 1% higher and consumption that is 3% lower than last winter.
In the 10%-colder-than-forecast scenario, EIA’s forecast expenditures for propane are $266 higher than last winter in the Northeast, reflecting prices that are 14 cents/gal (4%) higher than last winter and consumption that is 10% higher. Forecast expenditures are $236 higher than last winter in the Midwest, reflecting prices that are 21 cents/gal (11%) higher than last winter and consumption that is 5% higher.
In the 10%-warmer-than-forecast scenario, EIA’s forecast expenditures are $285 lower than last winter in the Northeast, reflecting prices that are 29 cents/gal (9%) lower than last winter and consumption that is 7% lower. Forecast expenditures are $246 lower than last winter in the Midwest, reflecting prices that are 15 cents/gal (8%) lower than last winter and consumption that is 11% lower.
EIA forecasts that propane production at natural gas plants and refineries will be 14% higher this winter than last winter, total consumption is expected to be the same as last winter, and net exports are expected to be 19% higher than last winter.
Propane inventories typically build between April and October and begin drawing down in late September or October as temperatures begin to drop. U.S. propane (including propylene) inventories at the end of September were 79.4 million barrels, which was 8% lower than the previous five-year average for that time of year. The low U.S. inventories are primarily the result of U.S. Gulf Coast inventories that were 19% lower than the five-year average going into the heating season. Strong global demand for propane contributed to U.S. Gulf Coast inventories that have remained on the low side of the normal inventory range since early 2017.
Inventories in the Midwest, the region that relies most on propane for heating and agricultural uses, ended September 3% higher than the five-year average. Propane prices are higher at the Gulf Coast market hub at Mont Belvieu, Texas, than at the Midwest hub at Conway, Kansas, which may provide incentive for more propane to move to the Gulf Coast. Regional Midwest data shows stocks at or higher than the five-year averages in all of the various sub regions.
Inventories in the Northeast ended September 33% higher than the five-year average, mainly because of high inventories in the Middle Atlantic region. Interruptions in service of the Mariner East 1 pipeline and delays in completing the Mariner East 2 pipeline, both of which limit propane from reaching and being exported from the Marcus Hook terminal, may have contributed to larger-than-normal inventory builds in that region. Despite higher crude oil prices, propane prices in the Northeast are expected to be similar to last winter partly because of improved logistics in the region and higher-than-normal inventories in Canada, which are expected to provide greater access to propane supplies.
Wood: About 2.1 million households (2%) used cord wood or wood pellets as the primary residential space-heating fuel in 2017. EIA estimates another 8% of households use wood as a secondary source of heat, making wood second to electricity as a supplemental heating fuel. In 2015, one in four rural households used wood for primary or secondary space heating, compared with 6% of urban households, according to EIA’s Residential Energy Consumption Survey. Wood use was most common in New England, where 21% of households used wood.
Natural Gas: Nearly half of all U.S. households heat primarily with natural gas. EIA expects households heating primarily with natural gas to spend about $30 (5%) more this winter compared with last winter. A less than 1% increase in consumption and an almost 5% increase in price is driving the increase in forecast expenditures compared with last winter. For the winter of 2018–19, EIA forecasts residential natural gas prices to average $10.29 per thousand cubic feet (Mcf), and average household consumption is forecast to total 58 Mcf. The increase in consumption reflects forecast HDD that are 1% higher this winter compared with last winter.
EIA expects natural gas spot prices at the U.S. national benchmark Henry Hub to average $3.20 per million British thermal units (MMBtu) ($3.32/Mcf) this winter, which is 8% higher than last winter. This higher Henry Hub price reflects increased natural gas use in the electric power sector, growing natural gas exports from liquefied natural gas (LNG) liquefaction facilities, and lower-than-average inventory levels. Increases in natural gas spot market prices generally pass through to residential prices over a long period of time. State utility commissions can set the rates that utilities can charge for natural gas deliveries a year or more in advance to reflect the cost of wholesale natural gas that utilities purchased over many months. In addition, residential prices include charges to cover utility operating costs and the cost to transport and distribute natural gas that are not directly linked to spot market prices.
Under a 10%-colder-than-forecast scenario, EIA expects that natural gas consumption would be 9% and natural gas prices would be 6% higher than last winter and resulting household expenditures would be 16% higher than last winter. Under a 10%-warmer-than-forecast scenario, EIA forecasts natural gas consumption would be 8% lower, prices would be 5% higher, and resulting household expenditures would be 4% lower than last winter.
EIA forecasted working natural gas inventories to total 3.3 trillion cubic feet (Tcf) by the end of October, or 14% lower than the October 2017 end-of-month level. Lingering cold temperatures during April 2018 (the coldest April in the past 21 years) delayed the start of the refill season until April 27, about four weeks past the start of the typical injection season, which runs from April 1 to October 31. In addition, very warm spring and summer temperatures contributed to a high level of natural gas usage for electricity generation. These factors led to end-of-month October storage levels that are currently forecast to be about 0.5 Tcf (14%) lower than both the October 2017 level and the five-year (2013–17) average. This forecast inventory level would be the lowest end-of-October storage level since 2005, when inventories ended the month at 3.2 Tcf. Although the end of October is typically considered the end of the storage injection season, injections commonly occur in early November, depending on temperatures and other market conditions.
Under the baseline temperature scenario for winter 2018–19, where HDD are forecast to be 1% higher than last winter, EIA expects natural gas inventories to be 1.4 Tcf at the end of March 2019, which would be 17% less than the five-year (2014–18) average level for the end of March. However, under a 10% colder-than-forecast scenario, inventories would be expected to end March 2019 at 0.8 Tcf, which would be 50% lower than the five-year average. In a 10% warmer-than-forecast scenario, inventories would be expected to end March 2019 at almost 1.8 Tcf, which would be 6% more than the five-year average.
Utilities and local distribution companies have a regulatory obligation to meet residential and commercial customer demands, and continued increases in U.S. natural gas production may have reduced the need for these companies to carry high storage inventories. EIA forecasts dry gas production will average 86.3 billion cubic feet per day (Bcf/d) this winter, which would be an increase of 7.6 Bcf/d (10%) from last winter. In addition, new pipeline infrastructure in the Northeast and South Central regions of the country has enabled the shipment of natural gas from production centers to demand centers, creating a more flexible pipeline grid and further reducing the need to maintain high inventory levels at storage centers.
Although inventory levels are low, EIA expects natural gas supplies to be adequate to meet winter demand. However, low inventory levels could create wholesale price volatility and localized wholesale price spikes in the event of cold temperatures, particularly a prolonged cold snap. Although a spike in wholesale natural gas prices is not immediately reflected in retail prices, the additional cost of natural gas for utilities typically is reflected in a smaller increase in retail prices spread across many months. Price spikes resulting from constrained natural gas supplies can also have ripple effects through energy distribution systems. Higher wholesale prices or curtailments to electric power generators can cause electric generators to turn to other fuels during cold periods.
Electricity: EIA forecasts that households heating primarily with electricity will spend an average of $36 (3%) more this winter on their electricity bills. This increase in forecast expenditures is a result of 1% higher consumption, including both heating and non-heating uses of electricity, and 2% higher residential electricity prices than last winter. Among U.S. households, 40% rely on electricity as their primary heating source. Nearly two-thirds of homes in the South heat primarily with electricity compared with only 16% in the Northeast.
In the 10% colder-than-forecast scenario, household electricity expenditures are about $99 (9%) higher than last winter, largely because consumption is expected to be about 7% higher.
Although colder-than-expected weather tends to increase generation fuel costs, residential electricity prices would not rise immediately. Instead, the effect of colder temperatures would pass through to retail electricity rates over the succeeding months of 2019. The effect of 10%-colder-than-forecast temperatures on electricity prices would be greatest in New England, where annual average residential prices would be 8% higher next year if the winter is colder than forecast, in contrast to the region’s base case forecast of 5% growth.
The 10%-warmer-than-forecast scenario results in projected household electricity expenditures that are about $27 (2%) lower than last winter, almost all of which is attributed to lower consumption and relatively little change in winter prices compared with the baseline case.
The mix of energy sources used to generate electricity in the electric power sector this winter is slightly different from last year. The prices of coal and natural gas delivered to electric generators are expected to be relatively unchanged this winter. The forecast share of total generation provided by coal is 1% lower than last winter, averaging about 28%. However, EIA expects the share of generation from natural gas to rise from 31% to 33%. This increase is a result of a one percentage point decline in the generation shares of both nuclear power and hydropower, averaging 20% and 6%, respectively, during the winter of 2018–19, as well as a decline in coal use for electricity generation.
The expected reduction in the share of nuclear generation is a result of the August 2018
retirement of the Oyster Creek Generating Station in New Jersey. Additions of new capacity in 2018 contribute to EIA’s forecast that renewable energy sources other than hydropower will provide 11% of total U.S. winter generation in the electric power sector, up from slightly from last winter.
This report was prepared by the U.S. Energy Information Administration (EIA), the statistical and analytical agency within the U.S. Department of Energy. By law, EIA’s data, analyses, and forecasts are independent of approval by any other officer or employee of the United States Government. The views in this report therefore should not be construed as representing those of the U.S. Department of Energy or other federal agencies.